Change Fibonacci Arc Properties Dialog Box
Levels Tab
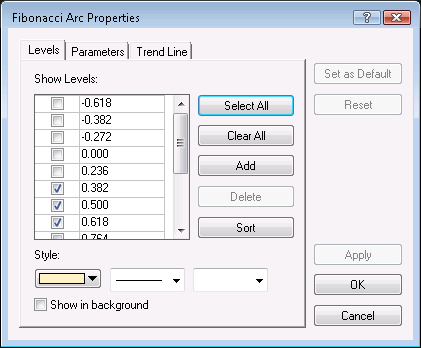
- Show Levels: if the check box of a Fibonacci arc level is selected, the level is
currently shown on the chart; otherwise, the level is hidden.
- Style: displays the current color, style and width of the level lines.
- Show in background: if the check box is selected, the Fibonacci arc is shown in
background under the prices; otherwise, the Fibonacci arc is shown above the prices.
Parameters Tab
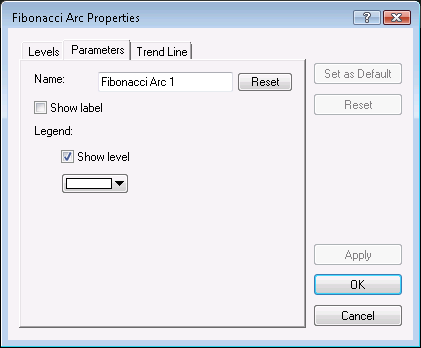
- Name: displays the current name of the Fibonacci arc; the name is shown in the
Fibonacci arc label.
- Show label: if the check box is selected, the Fibonacci arc label is currently
shown; otherwise, the label is hidden.
- Legend displays
- Show level: if the check box is selected, levels are currently indicated on
the level lines; otherwise, levels are not indicated. The following color box
displays the text color of levels in the legend.
Trend Line Tab
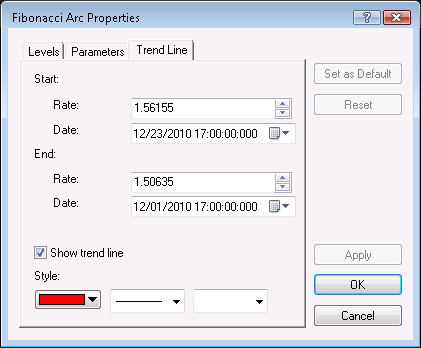
- Start displays
- Rate: the price level at which the trend line currently starts;
- Date: the date and time of the beginning of the period in which the trend
line currently starts.
- End displays
- Rate: the price level at which the trend line currently ends;
- Date: the date and time of the beginning of the period in which the trend
line currently ends.
- Show trend line: if the check box is selected, the Fibonacci arc trend line is
currently shown; otherwise, the trend line is hidden.
- Style: displays the current color, style and width of the trend line.
For details, see Change Fibonacci Arc Properties.
back