Create Chart Dialog Box
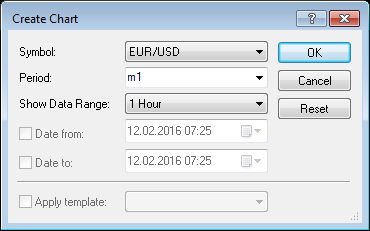
- Symbol: displays the symbol the price history of which will be shown on the
chart.
- Period: displays the period on the basis of which the price history will be
charted (for example, tick, monthly, daily).
- Show Data Range: displays the time interval to show.
- Date from: displays the starting date and time of the time interval the price
history of which will be shown on the chart.
The box is enabled if you have selected the Other value in the Show Data
Range box and selected the Date from check box.
- Date to: displays the ending date and time of the time interval the price history
of which will be shown on the chart.
The box is enabled if you have selected the Other value in the Show Data
Range box and selected the Date to check box.
- Apply template: if the check box is selected, the chart will be opened on the
basis of the selected template.
The check box is enabled if you have saved at list one template.
For details, see Create Chart.
back