Add Fibonacci Time Zones
Brief
The article explains how to add Fibonacci time zones.
Details
To add Fibonacci time zones to a chart
- Do one of the following:
- On the toolbar, click the Add Fibonacci arrow
 ,
and then click Add Fibonacci Time Zones.
- On the Insert menu, point to Fibonacci, and then click Add
Fibonacci Time Zones.
- Right-click in the chart, point to Chart Elements on the shortcut menu that appears, and
then click Add Fibonacci Time Zones.
- Press Z.
* When a chart is opened within the FXCM Trading Station, you can also select the tool in the following way:
On the Charts menu, point to Insert, point to Fibonacci, and
then click Add Fibonacci Time Zones.
- To add the tool, click in the chart to designate the period, through which the initial (0.000)
line is to be drawn, and drag the pointer to the period, through which the second (1.000) line is to be drawn. Note that while dragging
the pointer a line is being drawn automatically. You can follow the price direction and create a trend line. All other vertical lines
are drawn spaced on the basis of the Fibonacci numbers.
- The Add Fibonacci Time Zones dialog box appears.

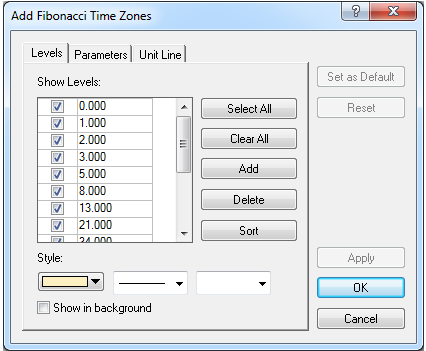
- By default, the box opens on the Levels tab, where you can do the following:
- Under Show Levels, in the list of available levels, select or clear check boxes at your choice (by default, all check
boxes are selected).
Notes:
- To select all available levels, click Select All.
- To clear the selection of levels, click Clear All. Note that to be able to add
Fibonacci Time Zones to the chart, at least one level must be selected.
- To edit a level value, click the appropriate row, double-click the current value, type a new value, and then press ENTER.
- To add a level, click Add. An empty row is added to the list. Type a value of your choice, and then press ENTER.
- To remove a level, click the appropriate row, and then click Delete.
- To sort the levels in ascending order, click Sort.
- In the appropriate Style boxes, select the tool lines' color, style, and width of your choice.
- To show the Fibonacci tool in background, select the Show in background check
box. Otherwise, clear the check box.
- To specify the tool's parameters, click the Parameters tab.
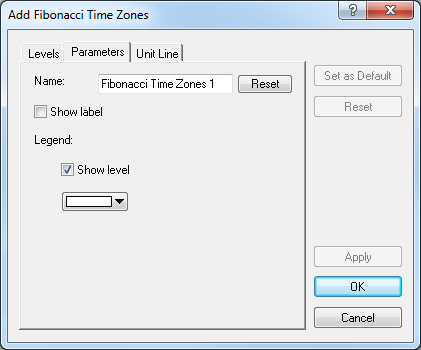
- The dialog box opens on the Parameters tab.

- In the Name box, type a name of your choice.
Note: To reset the default Fibonacci tool's name, click Reset.
- To show the Fibonacci tool's label, select the Show label check box.
Otherwise, clear the check box.
- To show the level values of the vertical lines, under Legend, select the Show level check
box. Otherwise, clear the check box.
- To change the color of the legend level, click the color of your choice in the
appropriate box.
- To specify the trend line's parameters, click the Unit Line tab.
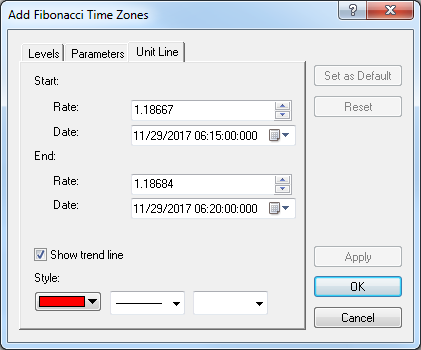
- The dialog box opens on the Unit Line tab.

- To specify the starting and/or ending prices and date and time values,
in the appropriate Rate and Date boxes, select or type values of your choice.
- To show the trend line, select the Show trend line check box. Otherwise,
clear the check box.
- In the appropriate Style boxes, click a color, style, and
width of your choice.
Notes:
- To apply the specified properties (except for Name) to all Fibonacci Time Zones tools to be added in the
future by default, click Set as Default.
- To restore the factory settings, click Reset.
- Click OK.
To change the default options of the Fibonacci tool, see Fibonacci Time Zones Options.
Notes:
- You can use the Fibonacci Time Zones tool until its time period specified by the Tool timeout option expires. To change
the time period, see the Chart Element Options] article.
- To disable the Fibonacci Time Zones tool, do the same as for selecting it or one of
the following:
- Right-click in the chart.
- Press ESC.
back
 ,
and then click Add Fibonacci Time Zones.

