- On the toolbar, click the Add Shape arrow
 ,
and then click Add Rectangle.
To choose the drawing mode, point to Add Rectangle and then click a mode of your choice. - On the Insert menu, point to Shapes, and then click Add Rectangle.
- Right-click in the chart, point to Charts Elements on the shortcut menu, and then click Add Rectangle.
- Press R.
* When a chart is opened within the FXCM Trading Station, you can also select the Rectangle tool in the following way: On the Charts menu, point to Insert, point to Shapes, and then click Add Rectangle.
The points automatically adjust in accordance with the selected drawing mode.

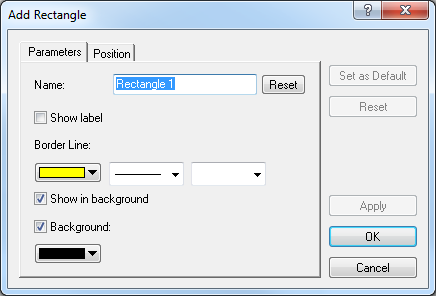
- In the Name box, type a new name of your choice.
Note: To restore the default rectangle name, click Reset. - To show the rectangle label, select the Show label check box. Otherwise, clear the check box.
- In the appropriate Border Line boxes, click a color, style, and width of your choice.
- To show the rectangle in background, select the Show in background check box. Otherwise, clear the check box.
- To specify the rectangle's background, select the Background check box. Otherwise, clear the check box.
- Once the Background check box is selected, the background color box below it becomes active. Click the arrow and, from the color palette that appears, select a color of your choice.

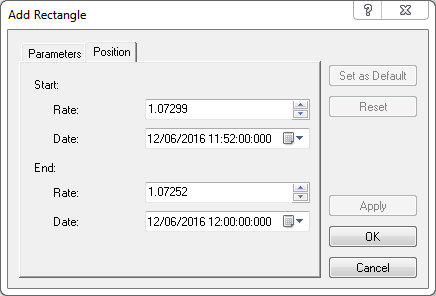
- To specify the rectangle's levels on the price and time axes, in the
appropriate Rate and Date boxes, select or type price and date and
time values of your choice.
Notes: - To apply by default the selected properties (except for Name) to all rectangles to be added to the chart in the future, click Set as Default.
- To restore the factory settings, click Reset.