Modify Rectangle Properties
Brief
The article explains how to modify properties of a rectangle.
Details
To modify properties of a rectangle
- Do one of the following:
- Double-click the rectangle's border line.
- Right-click the rectangle's border line, and then click Change 'Name', where
'Name' stands for the name of the rectangle.
- See Change Properties/Remove Chart Elements.
- The Rectangle Properties dialog box appears.

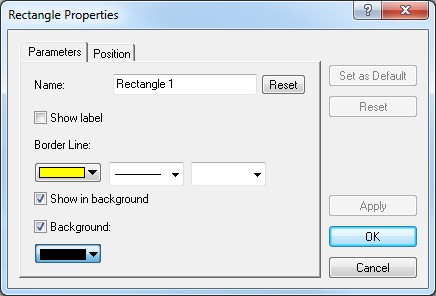
- On the Parameters tab, specify the parameters up to your choice:
- In the Name box, type a new name of your choice.
Note: To restore the default rectangle name, click Reset.
- To show the rectangle label, select the Show label check box. Otherwise,
clear the check box.
- In the appropriate Border Line boxes, click a color, style, and width of your choice.
- To show the rectangle in background, select the Show in background check box.
Otherwise, clear the check box.
- To specify the rectangle's background, select the Background check box. Otherwise,
clear the check box.
- Once the Background check box is selected, the background color box below it becomes active. Click the arrow and, from the
color palette that appears, select a color of your choice.
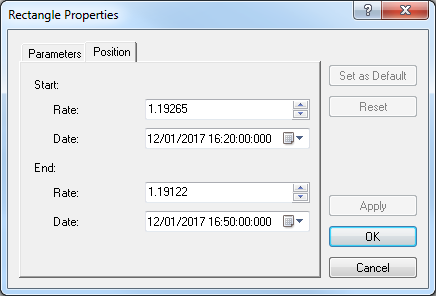
- On the Position tab, specify the rectangle position of your choice:

- To specify the rectangle's levels on the price and time axes, in the
appropriate Rate and Date boxes, select or type price and date and
time values of your choice.
Notes:
- To apply by default the selected properties (except for Name) to all rectangles to be added to the chart in the future,
click Set as Default.
- To restore the factory settings, click Reset.
- Click OK.
Notes:
- You can use the Rectangle tool until its time period specified by the Tool timeout option expires. To change the time
period, see the Chart Element Options] article.
- To disable the tool, do the same as for selecting it or one of
the following:
- Right-click in the chart.
- Press ESC.
back

