Price Overlay Properties Dialog Box
Parameters Tab
For price overlaid on the chart, the following picture appears:
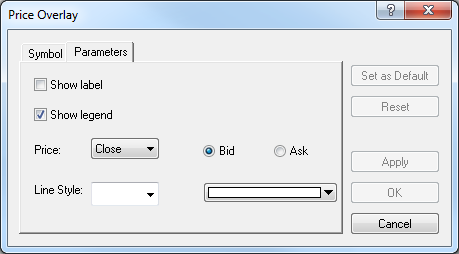
The window's options are:
- Show label: if the check box is selected, the label of the price overlay is to be displayed. Otherwise, no label is displayed.
- Show legend: if the check box is selected, the legend of the price overlay is to be displayed. Otherwise, no legend is displayed.
- Price: allows selecting a price source of the price overlay (Open, Close, High, Low, Tick Volume, Typical, Median, and Weighted) be displayed and Bid or Ask type of the prices.
For a price overlay displayed in a separate area below a Candlestick or Bar mode chart, the following picture appears:
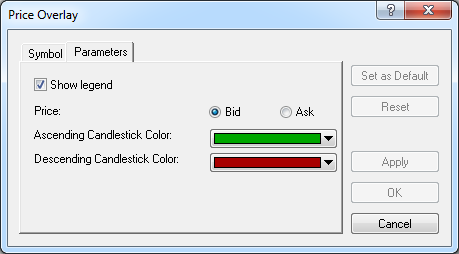
The window's options are:
- Show legend: if the check box is selected, the legend of the price overlay is to be displayed. Otherwise, no legend is displayed.
- Price: allows selecting Bid or Ask type of the prices.
- Ascending Candlestick/Bar Color: allows selecting a color of your choice for the ascending candlesticks or
bars.
- Descending Candlestick/Bar Color: allows selecting a color of your choice for the descending candlesticks or
bars.
For a price overlay displayed in a separate area below a Line mode chart, the following picture appears:
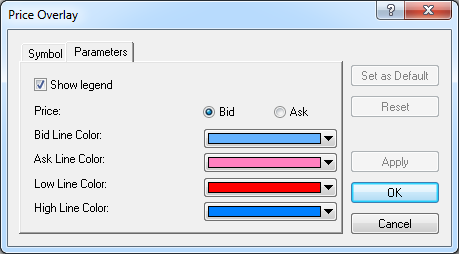
The window's options are:
- Show legend: if the check box is selected, the legend of the price overlay is to be displayed. Otherwise, no legend is displayed.
- Price: allows selecting Bid or Ask type of the prices.
- Bid Line Color: allows selecting the line color of your choice.
- Ask Line Color: allows selecting the line color of your choice.
- Low Line Color: allows selecting the line color of your choice.
- High Line Color: allows selecting the line color of your choice.
Symbol Tab
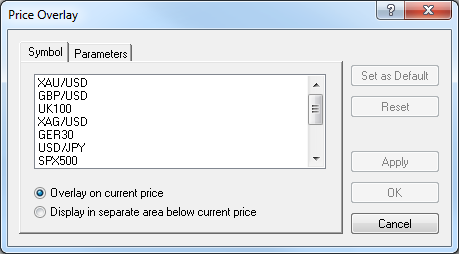
The main window contains a list of currently subscribed symbols, the prices of which can be
overlaid on the current chart. The other options are:
- Overlay on current price: if the option is clicked, the price overlay is to be
displayed on the current chart.
- Display in separate area below current price: if the option is clicked, the price overlay is to be displayed in a separate area below the current chart.
For details, see Price Overlaying.
back