- On the toolbar, click Create Chart.

- On the Charts menu, click Create Chart.
- Press CTRL + N.
To type the period, do the following:
- Type the first letter of the time unit you want to use (m for minutes, h/H for hours, d/D for days, w/W for weeks, and M for months).
- Type the number of time units of your choice (for m – 1, 2, 3, 4, 5, 6, 10, 12, 15, 20 or 30; for h/H – 1, 2, 3, 4, 6, 8 or 12; for d/D, w/W, and M the standard value is 1. You can also use the following custom periods: from 1 to 365 for days, from 1 to 51 for weeks, and 1, 2, 3, 4, 6 for months.). For example, to set a two-minutes period, a three-hours period, a one-day period, or a one-month period, you should type m2, h/H3, d/D1, or M1 respectively.
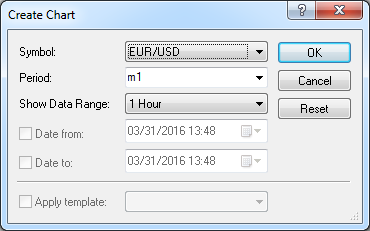
If Other is selected, the Date to and Date from check boxes become available. Select the check boxes at your choice, and then in the box on its right, select or type the date and time of your choice.
Notes:
- If the Date to check box is clear, all periods between Date from and the current period are displayed on the chart. If you create a tick chart and the number of ticks is more than 5,000, only 5,000 ticks before the current tick are displayed. If you create a bar chart and the number of periods in the selected data range is more than 15,000, only 15,000 periods before the current period are displayed.
- If the Date from check box is clear, 5,000 ticks before Date to are displayed on a tick chart and 15,000 periods before Date to are displayed on a Bar chart respectively.
- If the Date from and Date to check boxes are selected, all periods between Date from and Date to are displayed on the chart. If you create a tick chart and the number of ticks in the selected data range is more than 5,000, maximum 5,000 ticks before Date to are displayed. If you create a bar chart and the number of periods in the selected data range is more than 15,000, maximum 15,000 periods before Date to are displayed.
Note: When a chart is displayed within the FXCM Trading Station, the chart can be viewed in a separate window.