Charts in Trading Dialog Boxes
Brief
The article describes how you can open a chart in a dialog box for creating and changing orders and what you can see on it.
Details
To view a five minute chart for a selected symbol, in a dialog box (for example, the Create Market Order dialog box), click the Chart button.
The chart appears next to the dialog box.
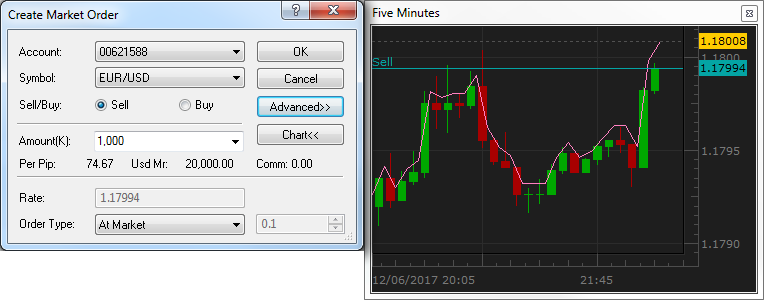
By default, it is a candlestick chart for the trade operation of your order and a line chart for the opposite trade operation.
You can customize the chart to your liking:
- To change the mode of the chart, right-click in the chart, point to Chart Mode, and then click the mode of your choice.
- To change the size of the chart, drag the borders.
- To fit the chart, zoom in or out, right-click in the chart, point to Zoom, and then click the command of your choice.
- To change the price or time scale, point to the appropriate axis and drag.
- To scroll the chart, point to it and drag to any four directions. To scroll to the end of the chart, right-click in the chart, and then click Scroll to End.
Charts in Create Orders Dialog Boxes
When you create an order, a line on the level of the order price appears on the chart.
The order price is also provided on a label on the price axis at the right border of the chart.
All your changes in the dialog box are immediately reflected on the chart, and vice versa.
- If the order is Market Range, you can set a range for it by holding CTRL and dragging the order line to the level of your choice.
Two lines indicating the price range appear on the chart.
When there are two range lines on the chart, you can also change the range by dragging either of the range lines to the level of your choice.
- If the order is Entry or Stop/Limit, you can change the order price by dragging its line to the level of your choice.
The current market price is provided on a label on the price axis.
Charts in Change Orders Dialog Boxes
When you change an order price, on the chart you can see the original order price (a grey line),
the new order price, and a vertical line connecting the two prices.
Associated orders and positions are shown on the chart together:
- A market order to close a position is shown on the chart together with the position to be closed.
- A stop/limit order is shown together with the order or position to which it is added and another stop/limit order if there is one.
- An entry order is shown together with stop/limit orders added to it.
If an order or position price is not visible on the chart, you can see markers at the upper or lower border of the chart.
To move the chart to make the order or position lines visible, click the marker.
back