Show/Hide Current Market Price
Brief
This section describes how to show/hide the current market price on a chart.
Details
The current market price can be indicated on a chart by a horizontal line with a tag.
- If the ask chart is shown, the horizontal line indicates the level of the current ask
price. The tag displays the current ask price.
- If the bid chart is shown, the horizontal line indicates the level of the current bid
price. The tag displays the current bid price.
- If both ask and bid charts are shown (for tick periods), the two horizontal lines are
displayed on the chart.
Note: If the current market price is out of the viewing area, the
horizontal line and its tag are not visible. In this case the line can be
accessed by means of scrolling and scaling. See Chart
Navigation.
In Marketscope 2.0 the current market price is displayed by a tag (tags) on
the price axis by default.
To show/hide the current market price:
- Do one of the following:
- On the File menu, click Options.
- Right-click in the vertical or horizontal scale, and then click Options.
- Right-click in the chart and then click Options.
* In the E*TRADE FX platform, the command is available on the System menu.
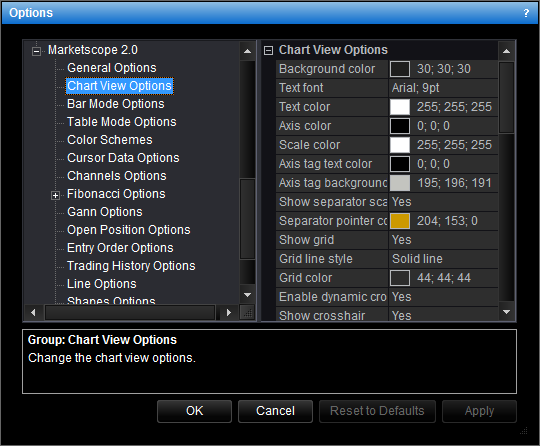
- The Options dialog box will appear.
- Click Chart View Options.

- Change the options:
- To show the current market price by a tag (tags) on the price axis, in the list or
options, click Show current market price, and then set the option to
Yes. Otherwise, set the option to No.
- To show the current market price line, in the list of options, click Show current
market price line, and then set the option to Yes. Otherwise, set the
option to No.
- Click OK.
You can change the options for the line and tag of the current market price. See
Current Market Price Options.
back
