Open Position Settings
Brief
This section describes how to show/hide open positions and net positions on a chart.
Details
You can set whether your open positions and net positions are displayed on the chart.
Show/Hide Open Position
An open position is indicated on a chart by a horizontal line with a label.
The horizontal line indicates the price level the position was opened at.
The label displays the trade operation (Long or Short), the date and time when the position was
opened and the current profit/loss in pips.
Note: Time is shown only for positions which were opened during the last 12 hours.
If the price of the open position is out of the viewing area, a marker is
displayed on the chart. By clicking the marker, you can view the line of the
position.
When you point to a line, label or marker of a position, a tooltip appears. The tooltip displays
the trade operation (Long or Short), the open price, the date and time when the position was
opened, and the current profit/loss in pips.
To show/hide an open position:
- Do one of the following:
- On the Trading menu, click Open Position Settings.
- Right-click in the chart, point to Show Trading Information on the shortcut
menu, and then click Open Position Settings.
* In the E*TRADE FX platform, the command is also available on the Charts
menu, on the Trading submenu.
- The Open Position Settings dialog box will appear.
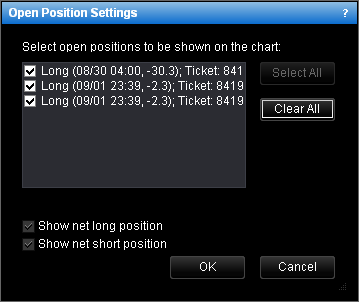
- To show/hide the position, in the list of positions, select/clear the appropriate check
box.
Note:
- If you want to show all open positions, click Select All.
- If you want to hide all open positions, click Clear All.
- Click OK.
You can show/hide all positions in the following way as well:
- Do one of the following:
- Go to the Trading menu.
- Right-click in the chart, point to Show Trading Information.
- To show/hide all open positions, click Show Open Positions.
* In the E*TRADE FX platform, you can also show/hide all open positions in the following
way:
On the Charts menu, point to Trading, and then click Show Open
Positions.
You can change the options for an open position. See Position Options.
Show/Hide Net Position
A net position shows an average entry price of all open positions with the
same trade operation and total profit/loss from all these positions in pips.
So if you have more than one open position with the same trade operation,
you can view a net position on the chart.
The net position is indicated on a chart by a horizontal line with a label.
The label displays the type of the net position (Short or Long) and the
total profit/loss in pips. If the price of the net position is out of the
viewing area, a marker is displayed on the chart. By clicking the marker,
you can view the line of the net position.
When you point to a net position line, label or marker, a tooltip appears.
The tooltip displays the net position type (Net Long or Net Short) and a
total profit/loss in pips.
To show/hide a net position:
- To show/hide the net short position, in the Open Position Settings dialog
box, select/clear the Show net short position check box.
- To show/hide the net long position, in the Open Position Settings dialog
box, select/clear the Show net long position check box.
You can change the options for a net position. See Net Position
Options.
back