Chart
Brief
The article describes the Chart menu.
Details
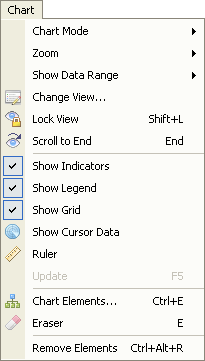
Clicking Chart on the menu bar opens the Chart menu.

The menu contains the following commands:
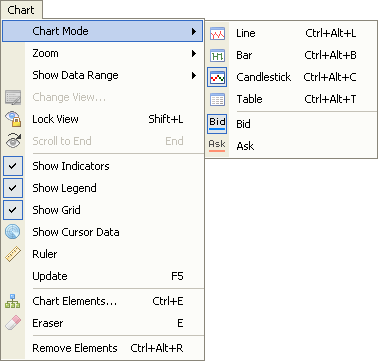
- Chart Mode opens the submenu.

The submenu contains the following commands:
- Line opens the chart in the Line mode. For details, see
Change Chart Mode.
- Bar opens the chart in the Bar mode. For details, see
Change Chart Mode.
- Candlestick opens the chart in the Candlestick mode. For
details, see Change Chart Mode.
- Table opens the chart in the Table mode. For details, see
Change Chart Mode.
- Bid displays the Bid prices on the chart.
- Ask displays the Ask prices on the chart.
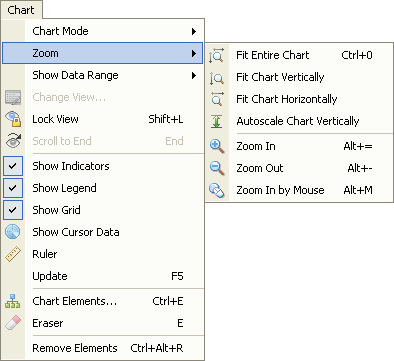
- Zoom opens the following submenu.

The submenu contains the following commands:
- Fit Entire Chart scales the chart axes so that all prices of the chart's data range fit into the
viewing area both vertically and horizontally. For details, see Fitting.
- Fit Chart Vertically scales the price axis so that all prices of the
currently displayed periods fit vertically into the viewing area.
For details, see Fitting.
- Fit Chart Horizontally scales the time axis so that all prices of the
chart's data range fit horizontally into the viewing area.
For details, see Fitting.
- Autoscale Chart Vertically enables/disables the automatic scaling of the price axis so that, when the chart is
scrolled, all the prices for the displayed periods fit vertically into the viewing area.
For details, see Scaling.
- Zoom In enlarges a chart's scale thus displaying a fewer number of periods. For details, see
Scaling.
- Zoom Out reduces a chart's scale thus displaying a greater number of periods. For details, see
Scaling.
- Zoom In by Mouse controls a chart's scale with a mouse. For details, see
Scaling.
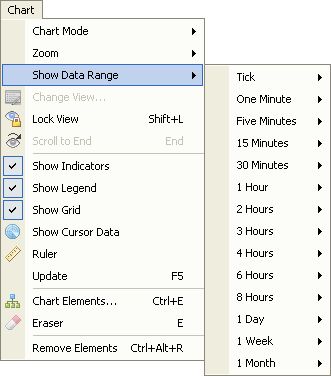
- Show Data Range opens the submenu containing a list of available chart periods. Pointing to any of the periods opens a list of available data ranges.

For details, see Change Period/Data Range.
- Change View allows modifying of the properties of the Kagi, Renko Candles, or Point and Figure chart. The command is available
only when one of the above-mentioned charts is active. For details, see Change View.
- Lock View enables/disables the automatic scrolling to the latest data thus preventing the chart from moving within the viewing area.
- Scroll to End scrolls the chart to its current period. The command is available only when the current period is out of the viewing area.
For details, see Scrolling.
- Show Indicators shows/hides indicators added to the chart. For details, see
Hide/Show Indicators.
- Show Legend shows/hides the chart legend. For details, see
Hide/Show Chart Legend.
- Show Grid shows/hides the grid. For details, see Show/Hide
Grid.
- Show Cursor Data shows/hides the cursor data. For details, see
Show/Hide Cursor Data.
- Ruler allows using of the ruler. For details, see Measure
Distances.
- Update updates the prices. For details, see Update
Prices.
- Chart Elements allows modifying of the properties of chart elements or remove chart elements from the chart. The command is available only when the chart contains at least one
element.
For details, see Change Properties/Remove Chart Elements.
- Eraser removes chart elements from the chart. The command is available only when
the chart contains at least one element. For details, see Eraser Tool.
- Remove All Elements removes all chart elements (by groups) from the chart. The
command is available only when the chart contains at least one element. For details, see
Remove All Chart Elements.
* When a chart is opened within the FXCM Trading Station, these commands are available on the Chart submenu, of the
Charts menu.
back


