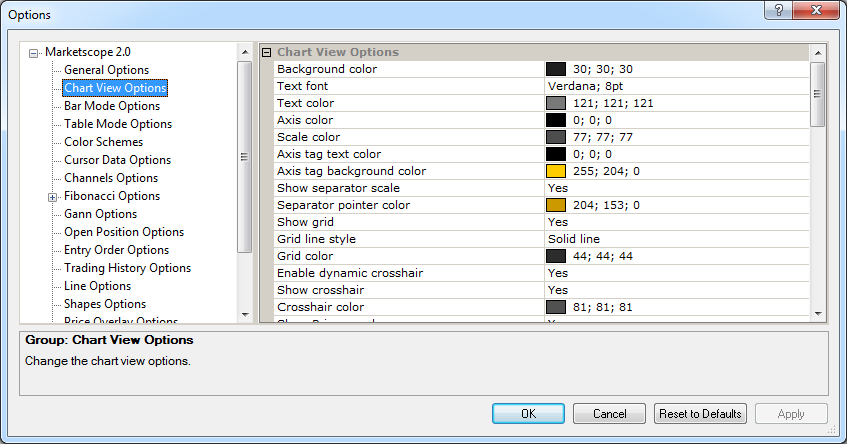
- On the File menu, click Options.
- Right-click anywhere in the chart, and then, in the menu that appears, click Options.
* In the FXCM Trading Station, the command is available on the System menu.


For convenience, the options are grouped as follows:
Chart Layout Options
Brief
The article explains how to customize a chart's layout: its background, borders, scales, separators, pointers, grid, crosshair, and current market price presentations.
Details
You can customize a chart's layout (the way a chart looks like on your computer): select the colors and fonts of letters and numbers, colors, widths, and styles of lines, as well as presence or absence of certain chart details.
To customize a chart layout


Chart appearance options
Option |
Description |
Background color |
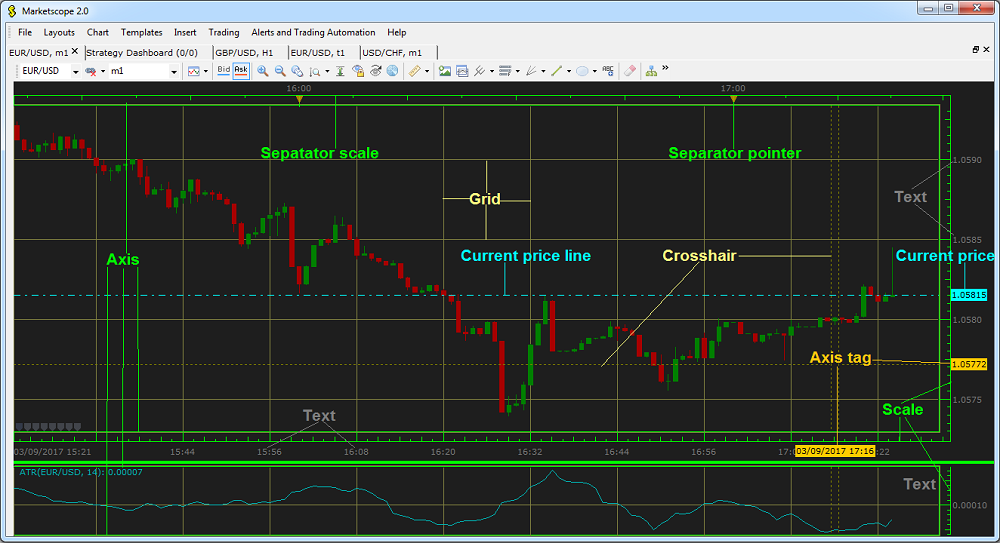
The option allows selecting the background color of the chart (see the picture above): click in the option row, click the ellipsis
|
Text font |
The option allows selecting the font and size of the numbers on the chart (see the picture above): click in the option row, click
the arrow |
Text color |
The option allows selecting the color of the numbers on the chart: click in the option row, click the ellipsis |
Scale color |
The option allows selecting the color of the chart scale (see the picture above): click in the option row, click the ellipsis |
Axis options
Option |
Description |
Axis color |
The option allows selecting the color of the chart axis lines (see the picture above): click in the option row, click the ellipsis |
Axis tag text color |
The option allows selecting the text color of the chart axis tag (see the picture above): click in the option row, click the ellipsis
|
Axis tag background color |
The option allows selecting the background color of the chart axis tag (see the picture above): click in the option row, click the ellipsis
|
Separator scale options
For more information, see the Show/Hide Separator Scale article.
Option |
Description |
Show separator scale |
The option allows showing or hiding the separator scale (see the picture above): click in the option row, click the arrow |
Separator pointer color |
The option allows selecting the color of the separator scale pointers (see the picture above): click in the option row, click the ellipsis
|
Grid options
For more information, see the Show/Hide Grid article.
Option |
Description |
Show grid |
The option allows showing or hiding the grid (see the picture above) on newly created charts: click in the option row, click the
arrow |
Grid line style |
The option allows selecting the style of the grid lines (see the picture above): click in the option row, click the arrow |
Grid color |
The option allows selecting the color of the grid lines: click in the option row, click the ellipsis |
Crosshair options
For more information, see the Enable/Disable Crosshair article.
Option |
Description |
Enable dynamic crosshair |
The option allows enabling or disabling a dynamic option of the crosshair (see the picture above): click in the option row, click the arrow
|
Show crosshair |
The option allows showing or hiding the crosshair (see the picture above): click in the option row, click the arrow
|
Crosshair color |
The option allows selecting the color of the crosshair lines: click in the option row, click the ellipsis |
Current market price options
For more information, see the Show/Hide Current Market Price article.
Option |
Description |
Show current market price |
The option allows showing or hiding the current market price tag and line (see the picture above): click in the option row, click the arrow |
Current market price tag text color |
The option allows selecting the color of the current market price tag text: click in the option row, click the ellipsis
|
Show current market price line |
The option allows showing or hiding the line of the current market price: click in the option row, click the arrow |
Current market price line color |
The option allows selecting the color of the current market price line: click in the option row, click the ellipsis
|
Current market price line style |
The option allows selecting the style of the current market price line): click in the option row, click the arrow |
Current market price line width |
The option allows selecting the width of the current market price line: click in the option row, highlight or delete the existing value, and then type a value of your choice. The values are whole numbers from 1 through 5. |
To enable the modified values, click OK at the bottom of the dialog box.