Open Position
Brief
The article describes all possible ways of opening a position.
Details
A position opens when a market, entry, or contingent order is executed. Entry and contingent orders are executed when the market
price hits the specified order rate and it takes some time, whereas, a market order is executed at the current market price and a position is opened right away.
To open a position with a market order
- Do one of the following:
- Click the tag of the current market price.
- Right-click in the chart or in the price values, and then click Create Market
Order.
- On the Trading menu, click Create Market Order.
- Press CTRL + SHIFT + M.
* In the FXCM Trading Station, the command is available on the Charts menu, on
the Trading submenu.
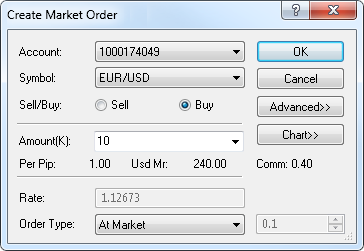
- The Create Market Order dialog box appears.

To view a five minute mini chart for the symbol shown in the Symbol box, click
Chart.
On the mini chart, you will see a line on the level of the current market price for the
trading operation selected in the dialog box.
- In the Account box, if you have more than one account, click the arrow
 , and then, in the list that appears, click an account of your choice.
- In the Symbol box, click the arrow
 , and then, in the list that appears, click a symbol of your choice.
- Click Sell or Buy to choose a trade operation.
- In the Amount[K] box, select or type an amount of your choice. Note that instead of Amount[K] Amount or GBP/Point
can be used. You can specify the Amount mode option in the Options dialog box of the System menu of your FXCM Trading Station.
For details, see the Change Amount Mode article in the FXCM Trading Station Help.
The cost of one pip price movement and required margin for the specified amount are shown next to Per Pip and Usd Mr respectively.
The trading commission to be charged for the specified amount is shown next to Comm.
- In the Order Type box, click the arrow
 , and then, in the list that appears, click an order type of your choice. The available values are
At Market and Market Range.
- If you click At Market, no further actions to be taken.
- If you click Market Range, in the Rate, in the box to the right, select or type a price range value of your choice in pips.
For more information, see Market Order.
- In the Time In Force box, click the arrow
 , and then, in the list that appears, click an order time-in-force value of your choice. The available
values are GTC, IOC, and FOK.
- GTC - stands for Good Till Canceled. It means that you want the total amount of your market order to be executed at the available market prices.
This order can be partially executed.
- IOC - stands for Immediate Or Cancel. It means that you want the maximum available amount of your market order to be executed at the available market prices.
This order can be partially executed. If there is no enough liquidity on the market, the order can be completely or partially canceled.
- FOK - stands for Fill Or Kill. It means that you want the total amount of your market order to be executed at the available market price either immediately or never.
Note that At Market orders have all three values: GTC, IOC, and FOK, while Market Range - only two: IOC and FOK.
- Select the Stop or Limit check box to add a stop/limit order to the order.
- If you select the Stop check box, in the Rate box immediately below it, specify a price value of your choice. To specify the value in pips, select the In pips check box at the
bottom of the dialog box.
In the Trailing box, click the arrow  , and then, in the list that appears, click a value of your choice. The available values are
None, Dynamic, and Fixed. Clicking Dynamic or Fixed makes the Stop order trailing. If you click Fixed, in the box
to the right, select or type a trailing step size of your choice in pips. The available values are from 10 through 300.
- If you select the Limit check box, in the Rate box below it, specify a price value of your choice. To specify the value in pips, select the In pips check box at the
bottom of the dialog box.
Note: If the Stop and Limit check boxes are selected, in the Profit/Loss window below, the Stop Loss and Limit Profit values are displayed.
- Click OK.
Once a position is created, it is displayed on the chart in one of the two ways:
- If the price at which the position has been opened is currently
visible on the chart, the position is displayed as a line with a
label. The label indicates the trade operation (Long or Short), the
date and time when the position was opened, and the current position
profit/loss in pips. Note that the time is shown only for positions opened during the last 12 hours.
- If the price at which the position has been opened is currently not visible on the
chart, a marker appears.
Notes:
- If the price is higher than prices displayed on the chart, a position marker appears
at the top border of the chart.
- If the price is lower than prices displayed on the chart, a position marker appears
at the bottom border of the chart.
- To make the position visible, click its marker.
When you point to a line, label or marker of a position, a tooltip
indicating the trade operation (Short or Long), the open price, the date
when the position was opened, and the current profit/loss in pips is
displayed.
If you add a stop or limit order to a position, it is displayed on the chart if its price is currently visible. The order is displayed as a line with a label. The label indicates
the order type and the expected position profit/loss in pips. The left parts of the labels of the position and its stop/limit order have the same color. The date and time when the order was created is
indicated on the line. If the price of the order is currently not visible, the order line with the label is not visible on the chart as well.
New Open Position Markers
Now you can also view an open position as a marker in the form of an arrow.
Buying is indicated by an upward arrow under the position line, selling is
indicated by a downward arrow above the position line. The marker also
indicates whether the position is profitable or loss-making by color, green
or red respectively. When you point to the marker, it is highlighted, and a
tooltip is displayed. The position marker is also highlighted when you point
to the position line or label, and vice versa.
When more than one position is opened in one period, instead of a number of
markers, a larger marker is shown to indicate all operations of one kind for
the period (buy operations are shown by a larger upward arrow, sell
operations are shown by a larger downward arrow).
Note: When both trading history and open
position markers are shown on the chart and positions were both closed and
opened in some period, instead of a number of markers, a larger marker is
shown to indicate all operations of one kind for the period (buy operations
are shown by a larger upward arrow, sell operations are shown by a larger
downward arrow). In this case a profit/loss label shows only profit/loss of
closed positions. When you point to the marker, you see a tooltip with
average open and/or close prices and profit/loss of positions opened and
closed in the period.
To show/hide the markers on a chart:
- Do one of the following:
- On the File menu, click Options.
- Right-click in the vertical or horizontal scale, and then click Options.
- Right-click in the chart and then click Options.
* In the FXCM Trading Station, the command is available on the System menu.
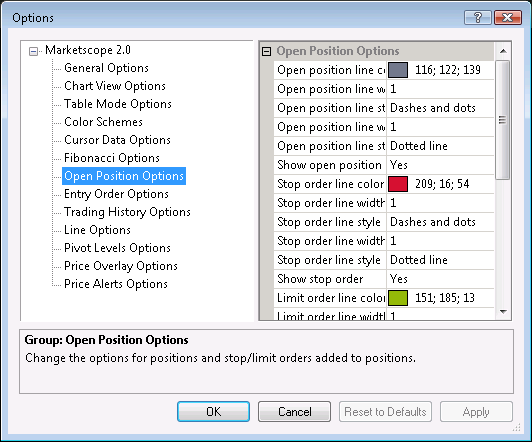
- The Options dialog box appears.
- Click Open Position Options.

- To show position markers, click Show markers, and then set the option to
Yes. Otherwise, set the option to No.
- Click OK.
back

 , and then, in the list that appears, click an account of your choice.
 , and then, in the list that appears, click a symbol of your choice.
 , and then, in the list that appears, click an order type of your choice. The available values are
At Market and Market Range.
 , and then, in the list that appears, click an order time-in-force value of your choice. The available
values are GTC, IOC, and FOK.
 , and then, in the list that appears, click a value of your choice. The available values are
None, Dynamic, and Fixed. Clicking Dynamic or Fixed makes the Stop order trailing. If you click Fixed, in the box
to the right, select or type a trailing step size of your choice in pips. The available values are from 10 through 300.