- On the File menu, click Options.
- Right-click in the chart and then click Options.
* In the FXCM Trading Station, the command is available on the System menu.
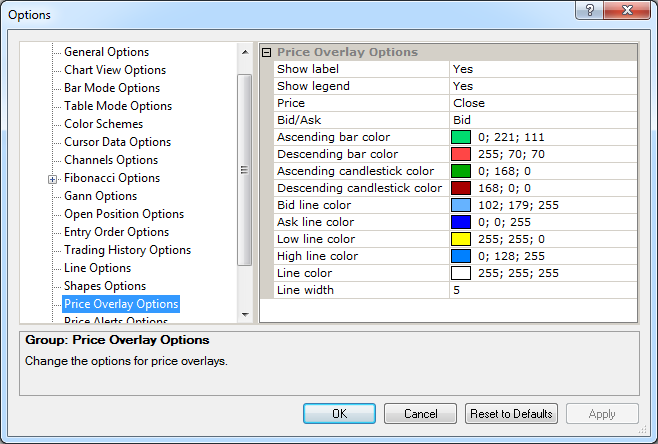
Price Overlay Options
Brief
The article explains how to customize the options for the Price overlay tool.c
Details
With the help of the Price Overlay tool, you can overlay prices of any one instrument on a chart or in an additional area below it.
You can also customize the options of price overlays in a variety of ways: select what prices to display (Bid or Ask), their data sources (Open, Close, High, etc.),
presentation colors and line widths, as well as selecting whether to show or hide labels and legends.
To customize the options:
Price Options
Option |
Description |
Price |
The option allows selecting the default price data source: click in the option row, click the arrow |
Bid/Ask |
The option allows selecting what prices (Bid or Ask) should be displayed by a price overlay. The values are: Ask and Bid. |
On-Chart Price Overlay Options
Option |
Description |
Show label |
The option allows selecting whether to show a price overlay label by default or not: click in the option row, click the arrow |
Show legend |
The option allows selecting whether to show a price overlay legend by default or not: click in the option row, click the arrow |
Line color |
The option allows selecting the default color of the price overlay line on a chart: click in the option row, click the ellipsis |
Line width |
The option allows selecting the default width of the price overlay line on a chart: click in the option row, highlight or delete the existing value, and then type or select a width value of your choice. The values are whole numbers from 1 through 5. |
In-Additional-Area Price Overlay Options
Option |
Description |
Ascending bar color |
The option allows selecting the default color of the ascending bars when the Chart Mode is Bar: click in the option row, click the ellipsis
|
Descending bar color |
The option allows selecting the default color of the descending bars when the Chart Mode is Bar: click in the option row, click the ellipsis
|
Ascending candlestick color |
The option allows selecting the default color of the ascending candlesticks when the Chart Mode is Candlestick: click in the option row, click the ellipsis
|
Descending candlestick color |
The option allows selecting the default color of the descending candlesticks when the Chart Mode is Candlestick: click in the option row, click the ellipsis
|
Bid line color |
The option allows selecting the default color of the Bid line when the Chart Mode is Line: click in the option row, click the ellipsis |
Ask line color |
The option allows selecting the default color of the Ask line when the Chart Mode is Line: click in the option row, click the ellipsis |
Low line color |
The option allows selecting the default color of the Low line when the Chart Mode is Line: click in the option row, click the ellipsis |
High line color |
The option allows selecting the default color of the High line when the Chart Mode is Line: click in the option row, click the ellipsis |
To enable the modified values, click OK at the bottom of the dialog box.
 button, and then,
in the Color palette that appears, select a color of your choice.
button, and then,
in the Color palette that appears, select a color of your choice.