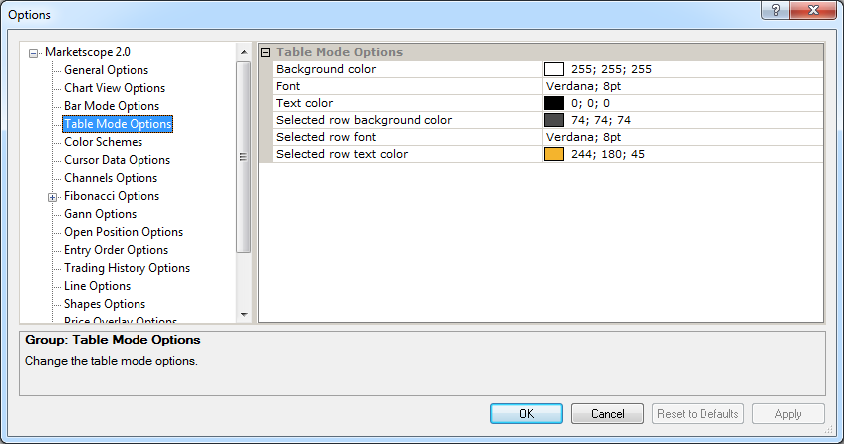
- On the File menu, click Options.
- Right-click in the chart and then click Options.
* In the FXCM Trading Station, the command is available on the System menu.

Table Mode Options
Brief
The article explains how to customize the options of the Table mode charts.
Details
When a chart is presented in the Table mode, it looks like a regular table, and you can customize the way its elements look like: its background color, the colors and fonts of numbers and letters, as well as the background color and colors and fonts of entries of selected rows. For more information, see the Change Chart Mode article.
To customize the options

Table mode options
Option |
Description |
Background color |
The option allows selecting the table background color: click in the option row, click the ellipsis
|
Font |
The option allows selecting the font and size of the table numbers and letters: click in the option row, click the ellipsis
|
Text color |
The option allows selecting the color of the table numbers and letters: click in the option row, click the ellipsis
|
Selected row background color |
The option allows selecting the color of a selected row background: click in the option row, click the ellipsis
|
Selected row font |
The option allows selecting the font of selected row numbers and letters: click in the option row, click the ellipsis
|
Selected row text color |
The option allows selecting the color of a selected row numbers and letters: click in the option row, click the ellipsis
|
To enable the modified values, click OK at the bottom of the dialog box.