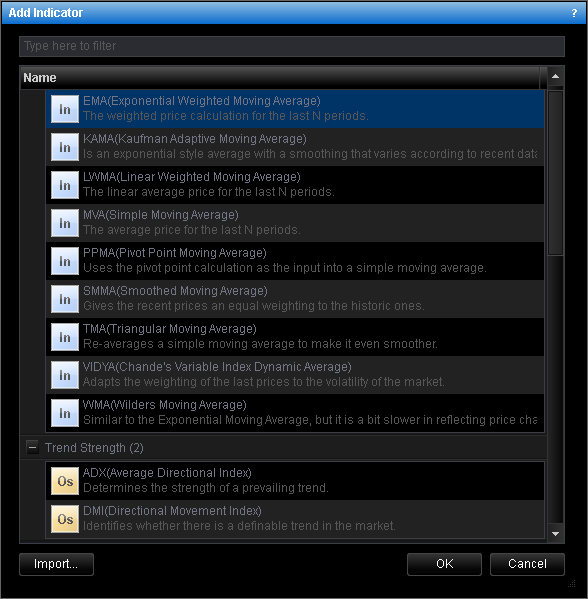
- On the toolbar, click the Add Indicator button.

- On the Insert menu, click Add Indicator.
- Right-click in the chart, and then click Add Indicator.
- Press I.
* In the E*TRADE FX platform, the command is available on the Insert submenu of the Charts menu.

Note that if the dialog box is called from a tick chart, the indicators requiring an OHLC bar as the data source (for example, ADX or Stochastic) are not listed as available.
The indicators are divided into several groups (by purpose of usage or by author). The recently used indicators are also shown in a separate group at the top of the list.
To be able to use your own indicator, add it to the list by clicking Import. For details, see Import Extensions.
Note: You can search for an indicator in the list by typing some letters of its name in the filter box at the top of the dialog box.
To choose an indicator, do one of the following:
- Double-click the indicator of your choice in the list.
- Click the indicator of your choice in the list, and then click OK.

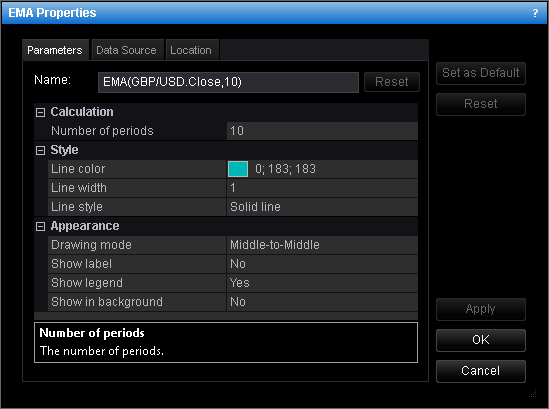
The set of parameters is determined by the chosen indicator.
- To change the name of the indicator, in the Name box, type a new name.
Note: To reset the indicator name to default, click Reset. - Change the specific indicator parameters if necessary.
- Change the Appearance parameters if necessary:
- To change a drawing mode parameter, click Drawing Mode, and then click the mode of your choice.
- To show or hide the indicator label, click Show label, and then click Yes or No.
- To show or hide the indicator legend, click Show legend, and then click Yes or No.
- To show the indicator in the background under the prices, click Show in background, and then click Yes; otherwise click No.
- To apply the changed properties (except for the Name parameter) to all future indicators of the kind by default, click Set as Default.
- To restore the indicator factory settings, click Reset.
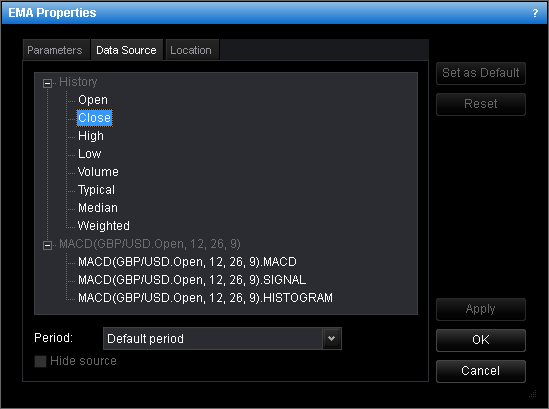
If the indicator has a tick source and its volume is provided, you can use the volume as a data source.

In addition to the Open, Close, High, and Low prices, you can use the Typical, Median, or Weighted price as a data source.
More than one price is taken into account to calculate these prices. Thus, more information about each period is used resulting in a smoother indicator. The prices are calculated as follows:
- The Typical price, which is an average of the High, Low, and Close prices, is calculated as the sum of High + Low + Close divided by 3.
- The Median price, which is an average of the High and Low prices, is calculated as the sum of High + Low divided by 2.
- The Weighted price, which is an average of the High, Low, and double Close prices, is calculated as the sum of High + Low + 2*Close divided by 4.
Notes:
- The Default period is the chart period, and, if you change it, the indicator period changes as well. If you select any other period value, it remains always the same regardless of the chart period changes.
- Select the same as the chart or greater period. If you try to add an indicator with a smaller period than that of the chart, only its legend appears on the chart meaning that the indicator is disabled. To enable the indicator and display it on the chart, change its period to make it same as the chart period or greater.

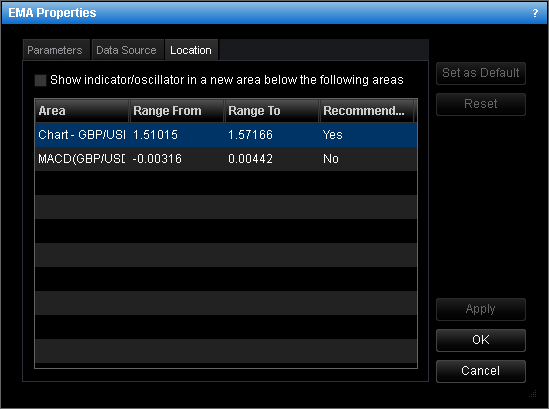
- To display the indicator in a new area below all other areas, select the Show indicator/oscillator in a new area below the following areas check box.
- To display the indicator in one of the existing areas (the chart, price overlay, or another indicator area), click the appropriate entry in the list.