Chart
Brief
This section describes the Chart menu.
Details
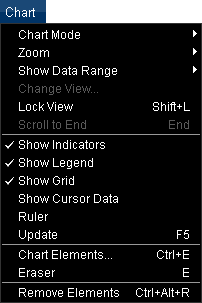
The Chart menu contains commands for managing the chart.

On the menu, the following commands are available:
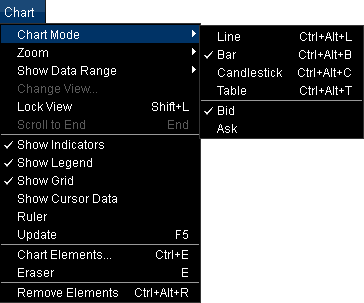
- Chart Mode: changes the chart mode. The command opens the submenu.

On the submenu, the following commands are available:
- Line: changes the chart mode to the Line mode. For details, see
Change Chart Mode.
- Bar: changes the chart mode to the Bar mode. For details, see
Change Chart Mode.
- Candlestick: changes the chart mode to the Candlestick mode. For
details, see Change Chart Mode.
- Table: changes the chart mode to the Table mode. For details, see
Change Chart Mode.
- Bid: displays the Bid prices on the chart.
- Ask: displays the Ask prices on the chart.
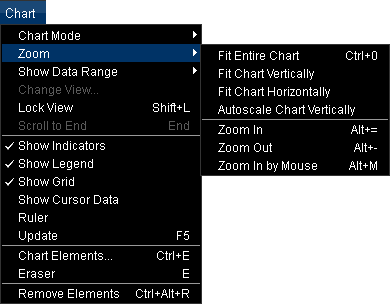
- Zoom: changes the scale of the chart. The command opens the submenu.

On the submenu, the following commands are available:
- Fit Entire Chart: scales the chart so that the entire chart fits into the
viewing area. For details, see Fitting.
- Fit Chart Vertically: scales the price axis so that all the prices of the
currently displayed periods are visible.
For details, see Fitting.
- Fit Chart Horizontally: scales the time axis so that all the periods of the
chart are visible.
For details, see Fitting.
- Autoscale Chart Vertically: scales the price axis so that, when the chart is
scrolled, all the prices for the displayed periods are visible.
For details, see Scaling.
- Zoom In: displays fewer periods on the chart. For details, see
Scaling.
- Zoom Out: displays more periods on the chart. For details, see
Scaling.
- Zoom In by Mouse: zooms in periods selected by mouse. For details, see
Scaling.
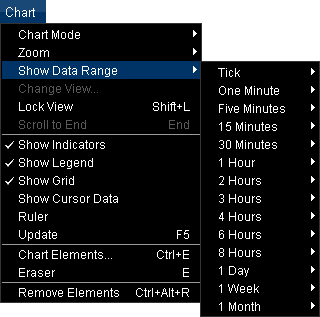
- Show Data Range: changes the data range for a chart period. For details, see
Change Period/Data Range.

- Change View: allows to change properties of the Kagi, Renko Candles, or Point and Figure chart. The command is available
only when one of the above-mentioned charts is active. For details, see Change View.
- Lock View: enables/disables the automatic scrolling to the latest data.
- Scroll to End: scrolls the chart to its last period. The command is available
only when the last period is not visible on the chart.
For details, see Scrolling.
- Show Indicators: shows/hides indicators. For details, see
Hide/Show Indicators.
- Show Legend: shows/hides the legend. For details, see
Hide/Show Chart Legend.
- Show Grid: shows/hides the grid. For details, see Show/Hide
Grid.
- Show Cursor Data: shows/hides the cursor data. For details, see
Show/Hide Cursor Data.
- Ruler: allows to use the ruler. For details, see Measure
Distances.
- Update: updates the prices. For details, see Update
Prices.
- Chart Elements: changes the properties of chart elements or removes chart
elements from the chart. The command is available only when the chart contains some
elements.
For details, see Change Properties/Remove Chart Elements.
- Eraser: removes chart elements from the chart. The command is available only when
the chart contains some elements. For details, see Eraser Tool.
- Remove All Elements: removes all chart elements (by groups) from the chart. The
command is available only when the chart contains some elements. For details, see
Remove All Chart Elements.
* In the E*TRADE FX platform, these commands are available on the Chart submenu, of the
Charts menu.
back


