Show/Hide Cursor Data
Brief
This section describes how to show/hide the cursor data.
Details
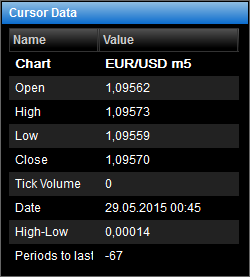
You can view the data of the currently selected period in the Cursor Data window. The window can
display the following data:
- The name of the chart.
- The prices for the selected period.
- The tick volume for the selected period.
- The start date of the selected period.
- The difference between high and low prices of the selected period.
It is not applicable for the tick chart.
- Indicators and their values in the selected period.
- The number of periods from this period to the last price.
- Lines.
- Price overlays.

When you move around the chart or switch to another chart, the cursor data change immediately to
display information about the period which is then currently selected.
You can show/hide the cursor data, as well as select which data to view.
To show/hide the cursor data, do one of the following:
- On the toolbar, click Cursor Data.

- On the Chart menu, click Show Cursor Data.
* In the E*TRADE FX platform you can also show/hide the cursor data in the following
way:
On the Charts menu, point to Chart, and then click Show Cursor
Data.
You can also hide the cursor data by right-clicking in the Cursor Data window and
selecting Hide Cursor Data.
To show/hide some of the cursor data:
- Right-click in the Cursor Data window.
- Do one of the following:
- To show/hide the chart name, click Show Chart Name.
- To show/hide prices, click Show Prices.
- To show/hide tick volume, click Show Tick Volume.
- To show/hide price overlays, click Show Price Overlays.
- To show/hide indicators, click Show Indicators.
- To show/hide lines, click Show Lines.
- To show/hide the number of periods to the last price, click Show Periods to Last
Price.
- To show/hide the start date of a period, click Show Date.
You can change the options for the cursor data. See Cursor Data
Options.
back


