Price Overlaying
Brief
This section describes how to view prices of a number of symbols on a chart.
Details
You can overlay a chart of some other symbol on your current chart or place
it in a separate area below the chart. This is useful when you use different
symbols for technical analysis and want to see their prices for the same
time interval and period.
Note that if you use a tick chart, you cannot overlay another chart on it.
On a chart you can overlay only the price of one symbol, and the price will
be displayed by a line. Below a chart you can place a number of price
overlays, and each overlay will be displayed by a chart of the same mode as
the current chart.
Add Price Overlay
To overlay price:
- Do one of the following:
- On the toolbar, click Price
Overlay.

- On the Insert menu, click Price Overlay.
- Right-click in the chart, point to Chart Elements on the shortcut menu, and
then click Price Overlay.
* In the E*TRADE FX platform, the command is available on the Charts menu, on
the Insert submenu.
- The Price Overlay dialog box will appear.
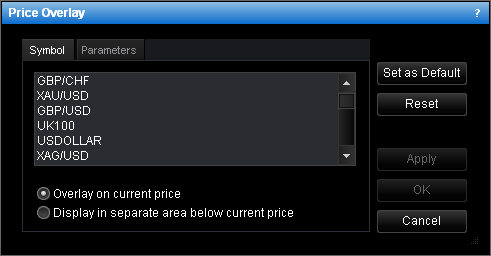
- Change the symbol settings on the Symbol tab if necessary:
- Select the symbol from the list.
- To view the price on the current chart, click Overlay on current price.
- To view the price overlay below the chart, click Display in separate area below
current price.
- Change the parameters of the overlay on the Parameters tab if necessary.
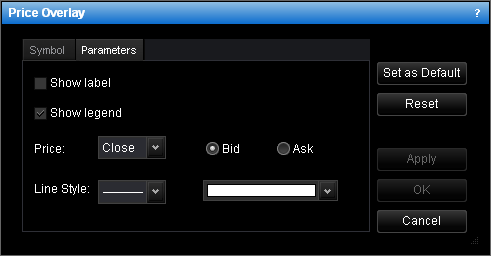
- To show the legend, select the Show legend check box. Otherwise, clear the
check box.
- To show Open, High, Low or Close price, select the appropriate price in the
Price box.
- To show bid or ask, click Bid or Ask.
For price overlaid on the chart:
- To show the line label, select the Show label check box. Otherwise, clear the
check box.
- To change the price line style and color, select your style and color in the
appropriate Line Style boxes.
For a price overlay displayed in a separate area below a line chart:
- To change the color of the bid, ask, low and high line, select your colors in the
appropriate color boxes.
For a price overlay displayed in a separate area below a candlestick or bar
chart:
- To change the color of ascending and descending candlesticks or bars, select your
colors in the appropriate color boxes.
- Click OK.
Change Price Overlay Properties
To change the properties a price overlay:
- Do one of the following:
- Double-click the price overlay.
- Right-click the price overlay, its legend or label, and then click 'Symbol'
Properties where 'Symbol' is the symbol the price of which is overlaid.
- See Change Properties/Remove Chart Elements.
- The 'Symbol' Properties dialog box will appear. ('Symbol' is the symbol of the
price overlay.)
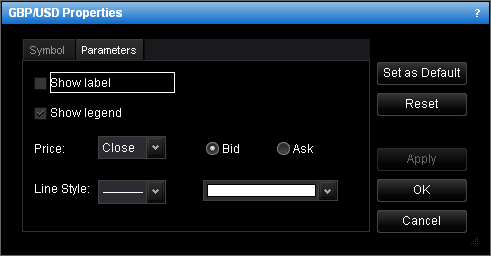
- Change the necessary properties.
Notes:
- To apply the changed properties to all further price overlays by default, click
Set as Default.
- To reset factory settings for the price overlay, click Reset.
- Click OK.
Remove Price Overlay
To remove a price overlay:
- Right-click the price overlay, its legend or label, and then click Remove.
- Click the price overlay and press DELETE.
- See Eraser Tool.
- See Change Properties/Remove Chart Elements.
Note that a price overlay displayed in a separate area is removed together
with the area. You can also remove the area together with the price overlay
by right-clicking in the area and selecting Remove Area.
Moreover, by right-clicking in the area and selecting the appropriate
commands, you can add indicators and other chart elements to this chart.
You can change the options for a price overlay. See
Price Overlay Options.
back