- On the toolbar, click the Add Shape arrow
 ,
and then click Add Rectangle.
,
and then click Add Rectangle.
To choose the drawing mode, point to Add Rectangle and then click the necessary mode. - On the Insert menu, point to Shapes, and then click Add Rectangle.
- Right-click in the chart, point to Charts Elements on the shortcut menu, and then click Add Rectangle.
- Press R.
* In the E*TRADE FX platform, you can also select the Rectangle tool in the following way:
On the Charts menu, point to Insert, point to Shapes, and then click Add Rectangle.
The points will be automatically adjusted according to the selected drawing mode if necessary.
As you release the mouse button, the Add Rectangle dialog box will appear.
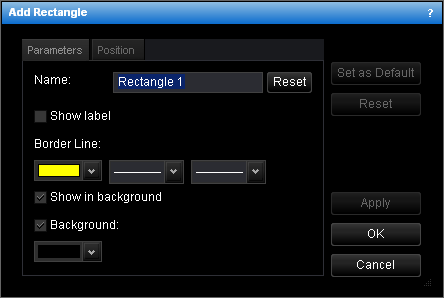
- To change the name, in the Name box, type a new name.
Note: To reset the rectangle name to default, click Reset. - To show the rectangle label, select the Show label check box. Otherwise, clear the check box.
- To change the border line style, in the appropriate boxes of Border Line, click the color, style and width of your choice.
- To show the rectangle in background, select the Show in background check box. Otherwise, clear the check box.
- To show the rectangle background, select the Background check box. Otherwise, clear the check box.
- To change the background color, in the Background box, click the color of your choice.
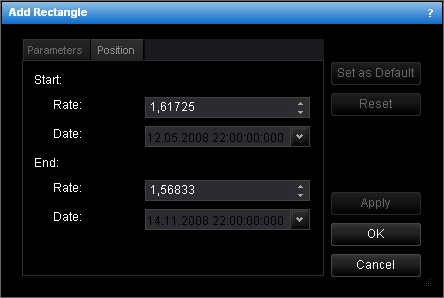
- To change the price and date and time at which the rectangle starts or ends, in the
appropriate Rate and Date boxes, select or type the price and date and
time.
Notes: - To apply the changed properties (except the name) to all further rectangles by default, click Set as Default.
- To reset factory settings for the rectangle, click Reset.